Argus Data Products
Images
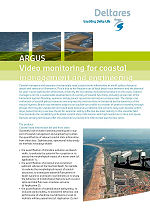
Each standard half-hourly collection usually consists of two types of images. A snapshot image (Fig. a) serves as simple documentation of the ambient conditions but offers little quantitative information. Time exposure images (Fig. b) average out natural modulations in wave breaking to reveal a smooth pattern of bright image intensities, which are an excellent proxy for the underlying, submerged sand bar topography. Time exposures also remove moving objects from the camera field of view, such as ships, vehicles and people. Plan view, merged images (Fig. c) can be composed by geo-referencing the images from all the cameras of an Argus station. This facilitates the measurement of length scales of morphological features like breaker bars and the detection of rip currents. Besides time-averaged video data, data sampling schemes can be designed to collect time series of pixel intensities, typically at 2 Hz, with which wave and flow characteristics can be investigated.
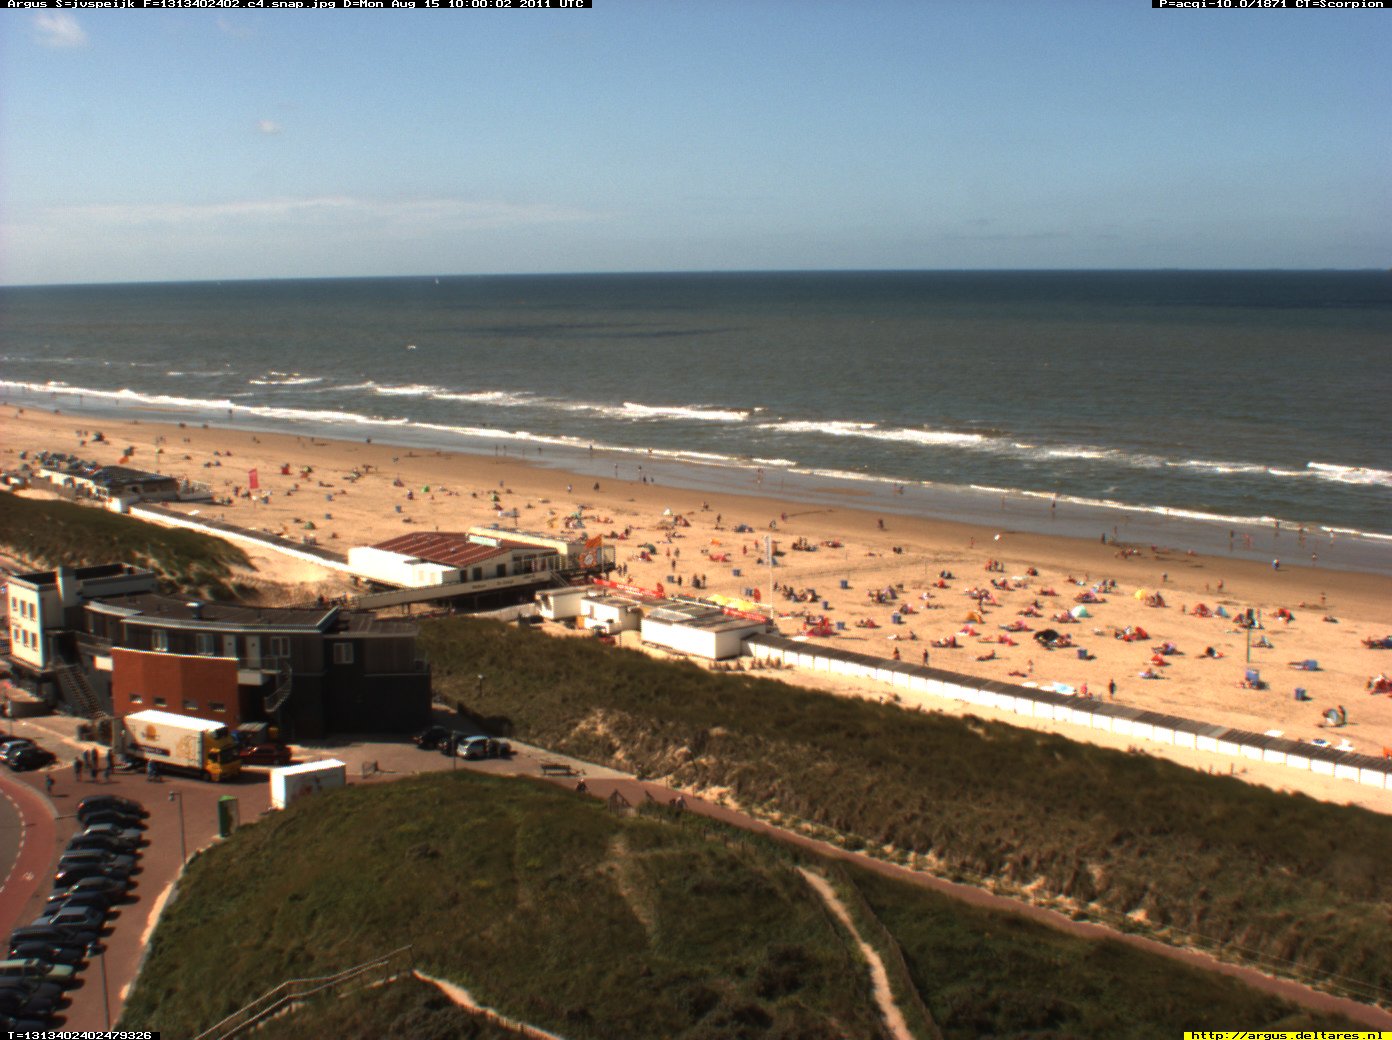
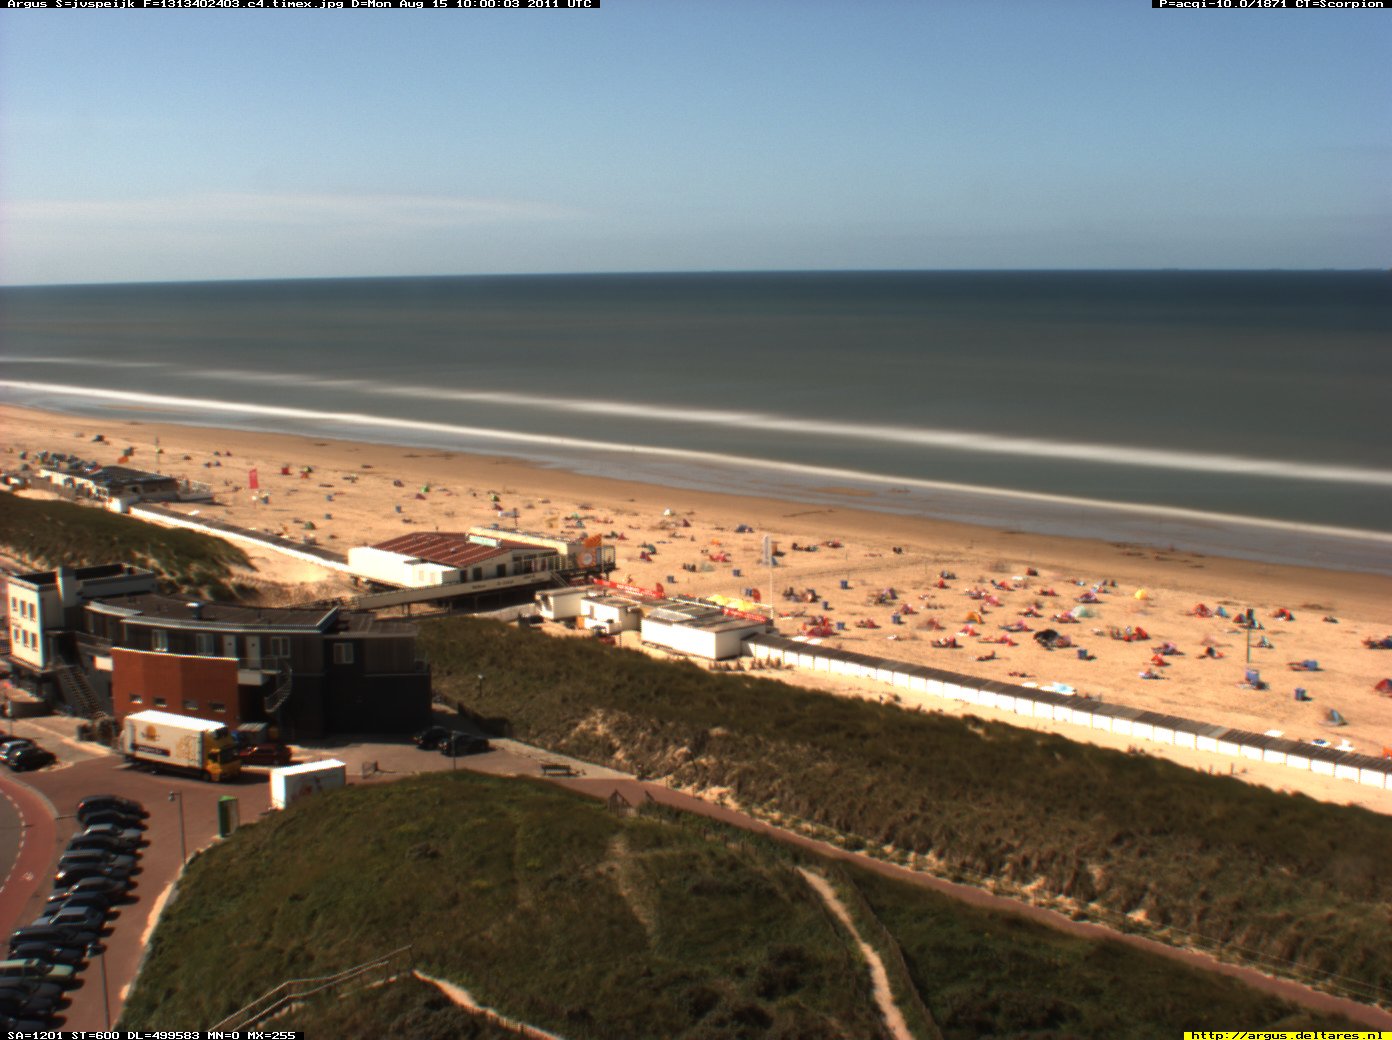
Figure: Overview of standard Argus image types: (a) snapshot, (b) time exposure, and (c) merged, plan-view image. The plan-view image shows the dry beach at the lower side and covers a coastal area of 800 m cross-shore by 3000 m alongshore
Information derived from Argus video images
The time exposure images show bright, longshore bands, clearly indicating the locations where waves preferably break. As the breaking of waves is caused by depth-limitation, the bright intensity patterns reflect underlying bottom topography. In addition, the location of the waterline can easily be identified. Taking into account the tidal level, this enables the intertidal beach bathymetry to be mapped using a sequence of hourly-sampled images. Finally, in the absence of breaking waves, local water depth could be estimated from the propagation speed of individual waves as observed from time series of image intensity at distinct locations. In this way, the morphologic changes of a coastal system can be monitored cost-effectively over long-term periods.
Successful use of video monitoring techniques in support of coastal management and engineering involves the quantification of relevant coastal state information from video data. Sophisticated, operational video analysis methods nowadays enable:
- quantification of shoreline evolution and beach width, to evaluate the potential for recreation or to assess the morphological impact of a storm event (cf. Application 1);
- quantification of erosional and accretional sediment volumes at the intertidal beach, for example to evaluate the morphological impact of coastal structures, to investigate seasonal fluctuations in beach dynamics and beach nourishments or to study the behaviour of morphological features such as sand spits and tidal flats near a harbour entrance (cf Application 2);
- quantification of subtidal beach bathymetry, to evaluate coastal safety, to assess the behaviour and performance of shoreface nourishments or even to facilitate military operations (cf. Application 3);
- quantification of wave run-up, to evaluate the stability of coastal structures such as seawalls, harbour moles and revetments (cf. Application 4).
Application 1: Quantification of storm-driven shoreline changes
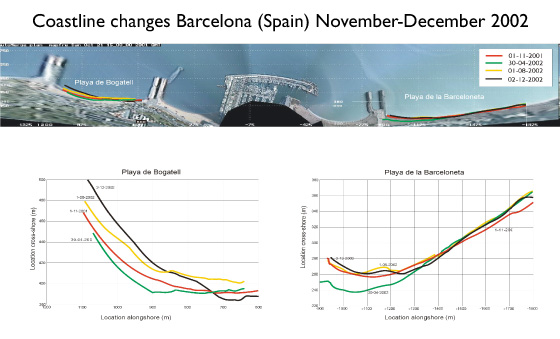
At Barcelona (Spain), a shoreline detection model was used to assess storm-driven shoreline changes in front of Puerto Olimpico. The model derives the location of the shoreline from time exposure images on the basis of the colour contrast between the dry and wet beach. Detailed observations show a shoreline retreat up to tens of meters during a single storm event. Figure courtesy of Dr. J. Guillen, CSIC, Barcelona.
Application 2: Intertidal morphological changes at a nourished beach
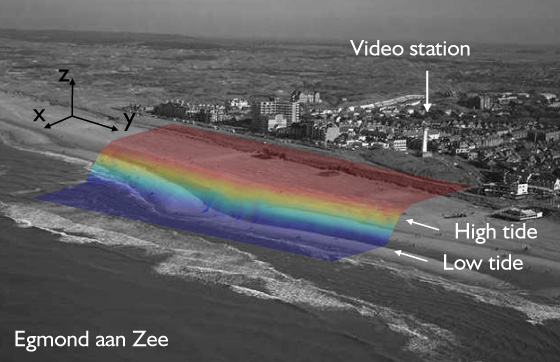
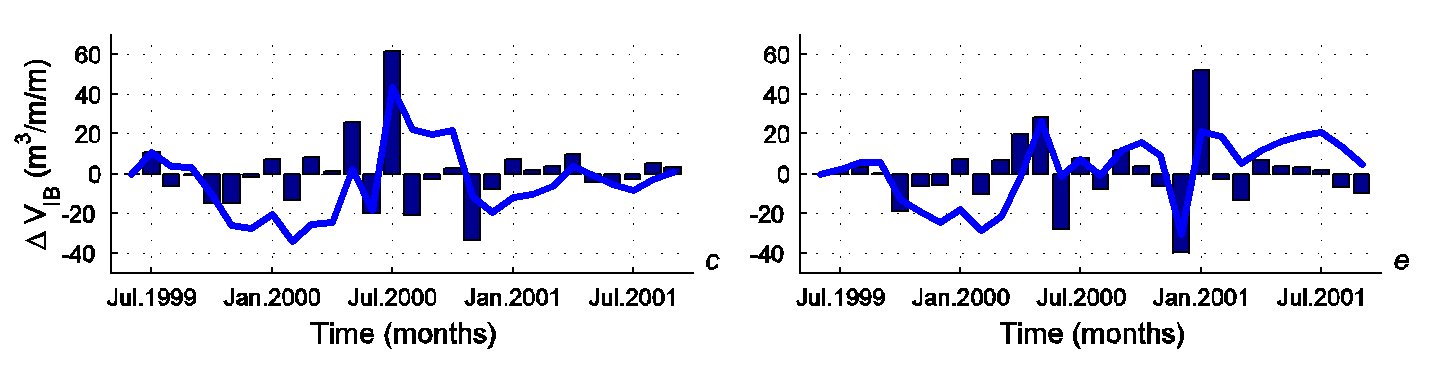
At Egmond (The Netherlands), intertidal beach bathymetries were determined on a monthly basis by mapping a series of video-derived shorelines at different water levels throughout a tidal cycle. The mean vertical offset of this model is less than 15 cm along 85% of the 2 km wide study region. The resulting bathymetries (e.g., Fig. a) were used to quantify patterns of erosion and accretion after a combined beach and shoreface nourishment. Example results are presented in the graphs (b and c), which show means of the monthly volume changes per meter coastline (bars), as well as the cumulative morphological changes (lines). Negative values denote erosion. Figure (b) presents the volume changes at a location 400 m to the south of the Argus station; Figure (c) presents volume changes at a location 400 m to the north of the station.
Application 3: Measurement of surf zone bathymetry
At Egmond (The Netherlands), Argus video imagery has been used to monitor the evolution of surf zone bathymetry after implementation of a shoreface nourishment in July 1999. The bed elevation is continuously updated on the basis of a comparison of video-derived and model-computed patterns of wave dissipation. This approach yields marginal deviations in the order of 10 to 20 cm at the seaward face of the bars, which increase up to 20 to 40 cm near the bar crest. The results show a shoreward migration of the outer bar after deployment of the shoreface nourishment in combination with a net accretion of sediment along the shallow part of the beach profile above the -2 m depth contour, thus confirming the beneficial impact of the nourishment.

Figure from Aarninkhof, S.G.J. (2003). Nearshore bathymetry derived from video imagery. PhD. Thesis, Delft University of Technology, 175 pp.
Application 4: Quantification of wave run-up on coastal structures
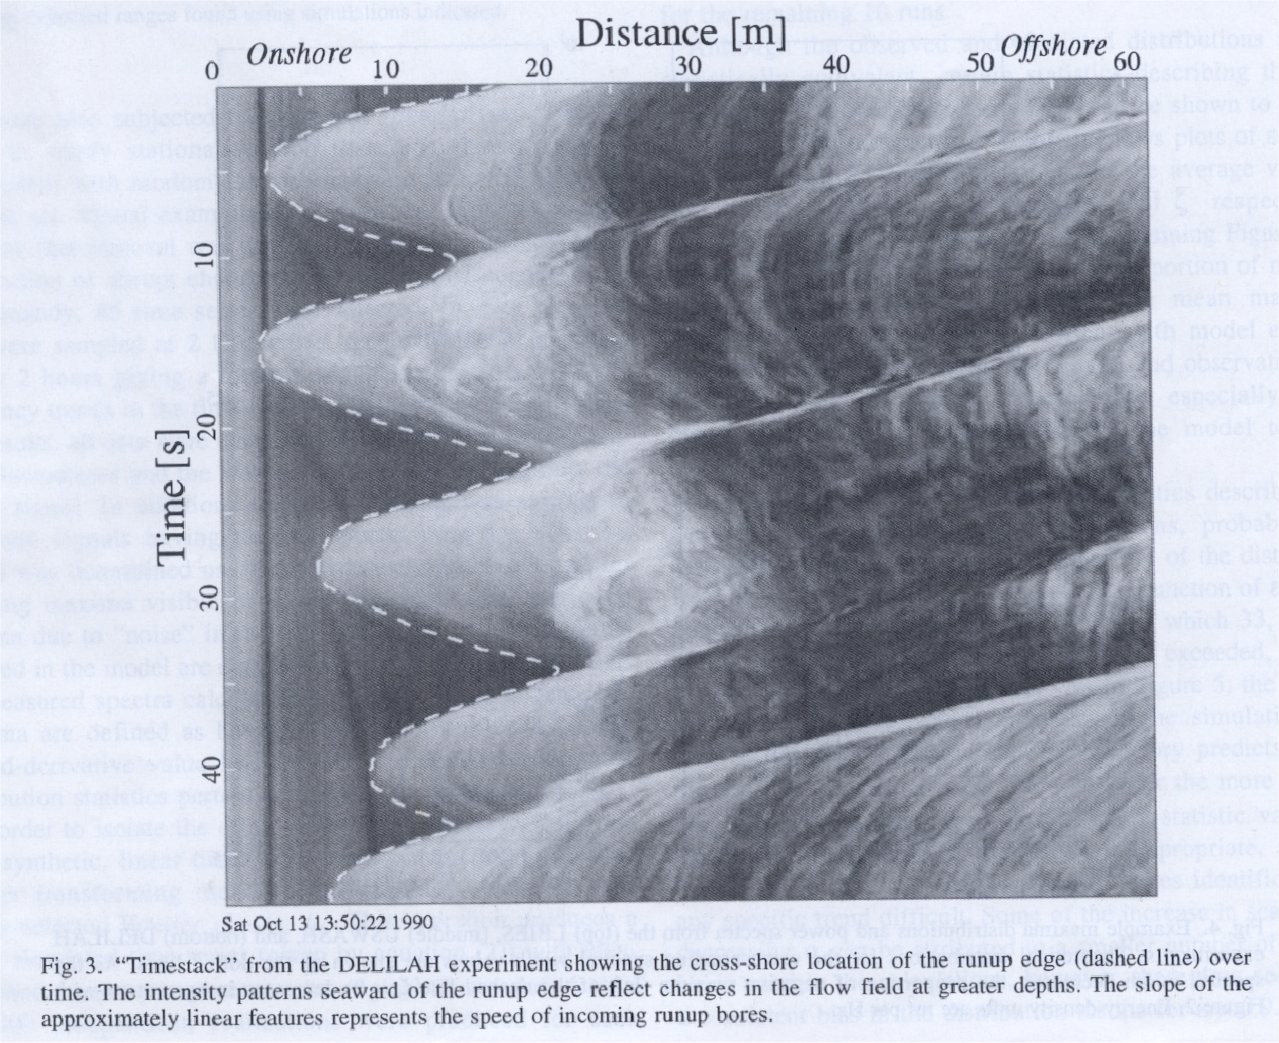
Wave run-up and wave overtopping are two of the mechanisms that may cause damage or even failure of coastal structures such as seawalls, harbour moles and groins. High frequency video observations (typically at 2 Hz) can be used to determine the statistics of wave run-up at beaches and coastal structures. The figure below shows an example of a timestack image, where pixel intensities are sampled along a cross-shore array in the swash zone and stacked over time. The position of the swash edge can be visually identified by the sharp change in intensity between the darker beach surface and the lighter foamy edge of the swash bore (after Holland and Holman, 1993). This type of monitoring yields information on the wave attack at structures during a single storm event or throughout the year.
Reference: Holland, K.T. and Holman, R.A., 1993. The statistical distribution of swash maxima on natural beaches. Journal of Geophysical Research, 98, pp. 10271-10278.
Other applications
In a research context, video monitoring techniques have been applied to quantify alongshore flow velocities, wave characteristics such as wave angle and period, the occurrence of algae bloom and the distribution and persistency of rip currents. Other applications involve the monitoring of visitor density at the beach and the prediction of rip currents.
The continuous collection of long-term, high-resolution data sets carries the additional advantage of a posteriori data selection, for instance for the consistent assessment of storm damage to public and private property and the early recognition of important erosion trends.